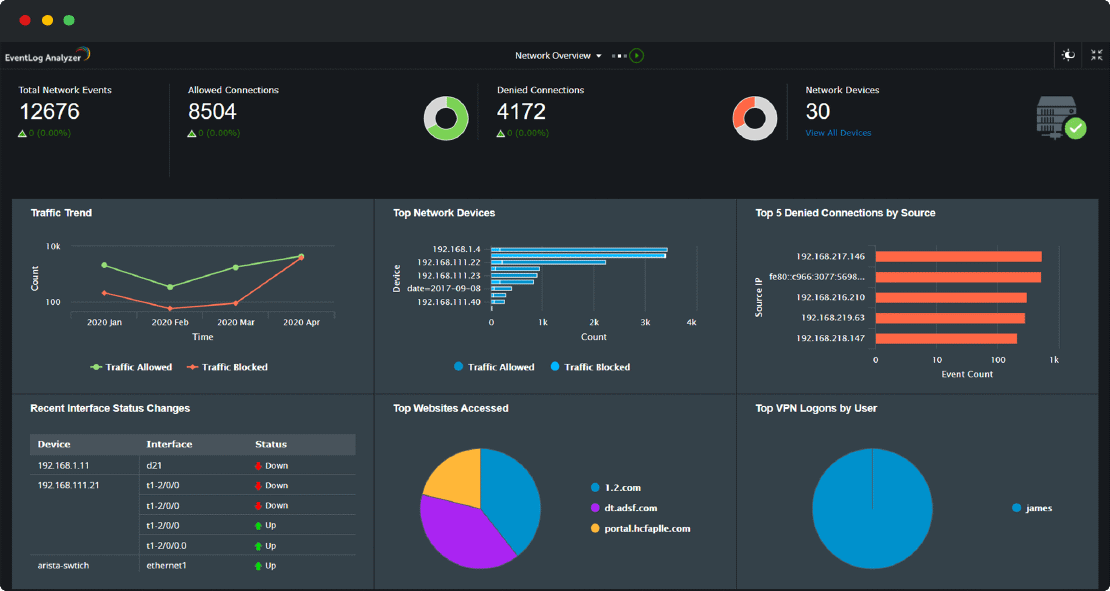
Monitoring and logging are essential components for maintaining healthy Kubernetes environments. Prometheus, Grafana, and the ELK stack are commonly used tools to collect, store, and visualize metrics and logs in Kubernetes.
In this article, we’ll look at the basics of Kubernetes monitoring and logging and explore how to set up these tools.
- Kubernetes Monitoring with Prometheus
- Visualizing Metrics with Grafana
- Centralized Logging with the ELK Stack
- Kubernetes Monitoring with Prometheus
Prometheus is an open-source tool designed for monitoring and alerting. It scrapes metrics from Kubernetes components and stores them in a time-series database.
To install Prometheus with Helm:
helm install prometheus stable/prometheus
- Visualizing Metrics with Grafana
Grafana is often used in conjunction with Prometheus to visualize metrics. To install Grafana:
helm install grafana stable/grafana
Access Grafana at http://
The ELK stack (Elasticsearch, Logstash, Kibana) is widely used for centralized logging in Kubernetes.
Elasticsearch stores logs.
Logstash processes and ships logs to Elasticsearch.
Kibana provides a user interface to query and visualize logs.
By integrating monitoring and logging solutions like Prometheus, Grafana, and the ELK stack, you can gain insights into your Kubernetes environment, identify issues, and maintain the health of your applications.


